

Portfolio Lens Research | October 2026
The Value of Being Wrong in Public
Wall Street has perfected the art of explaining yesterday’s events with tomorrow’s confidence. Earnings exceed expectations, and analysts discover that the outcome was inevitable. Results disappoint, and the same observers explain why the warning signs were obvious all along. Such retrospective wisdom is convenient, but it is not particularly useful. Investment analysis should demand something more rigorous: a judgment made before the facts arrive, followed by an accounting when they do. At Portfolio Lens, we decided to put that principle to work. Before Costco, Micron and Nike reported earnings, we published specific financial thresholds for bullish, neutral and bearish outcomes. We then compared those thresholds with the companies’ actual results. The exercise was designed not to demonstrate clairvoyance, but to impose a measure of accountability on a profession that too often confuses a persuasive explanation with an accurate forecast.
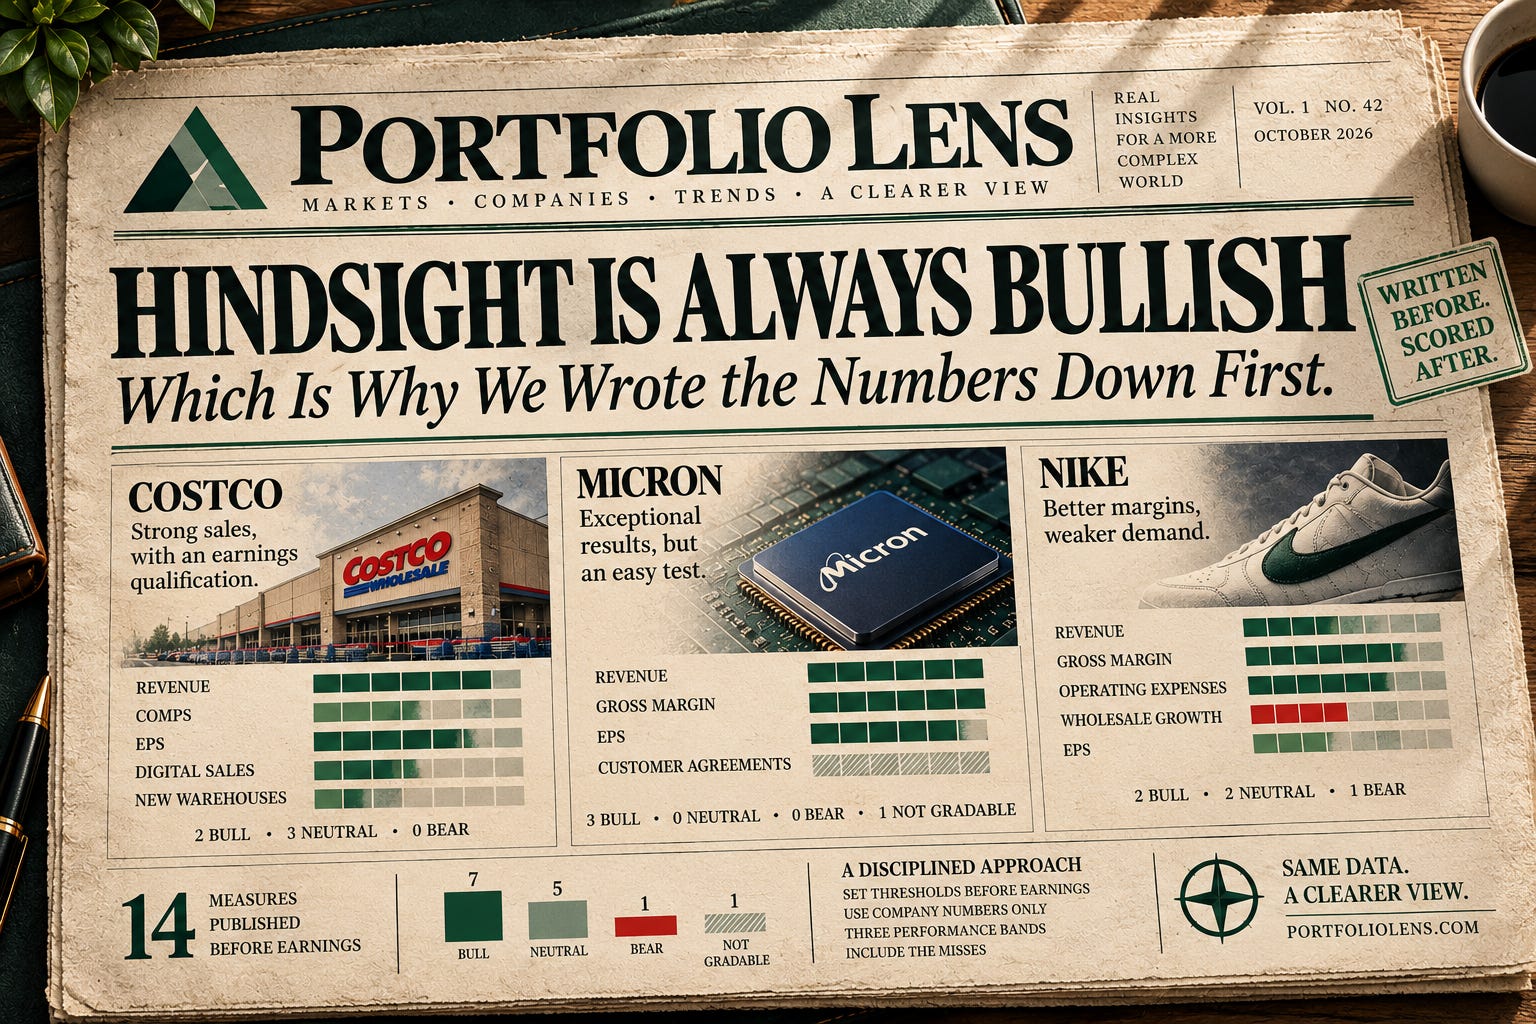
The results offer a useful reminder that corporate performance rarely fits neatly into the categories investors prefer. Micron cleared all three financial thresholds we could measure, although our own analysis revealed that we had made the task too easy by setting its revenue target at the midpoint of management’s guidance. Costco exceeded our revenue and earnings targets, but a one-time tariff refund helped lift earnings across the bullish threshold. Nike presented the most instructive contradiction: improving margins and disciplined expenses accompanied declining wholesale sales. Of the 14 measures we published, 13 could be evaluated: seven reached our bullish thresholds, five were neutral and one was bearish. One could not be measured because the company did not disclose the necessary information. The purpose of this scorecard is not to celebrate the seven successes or excuse the single failure. It is to establish a record that cannot be rewritten after the outcome is known. Markets have no shortage of opinions. What they need is a better accounting of which ones survived contact with reality.
How We Keep Score
We published our financial thresholds before each earnings announcement: Costco on September 24, Micron on September 28, and Nike on September 29.
These thresholds are not predictions of exact results. They define the performance required for a bullish, neutral or bearish assessment. We compare them with company earnings releases and SEC filings, not analyst estimates. A result at or beyond the bullish threshold earns a Bull grade. A result at or beyond the bearish threshold earns Bear. Everything between is Neutral. For expenses, lower is better.
We do not change thresholds after earnings. One-time items receive separate analysis, but the official grade follows the original rules. Measures that companies do not disclose remain ungraded.
The Scorecard
Costco: Strong Sales, With an Earnings Qualification
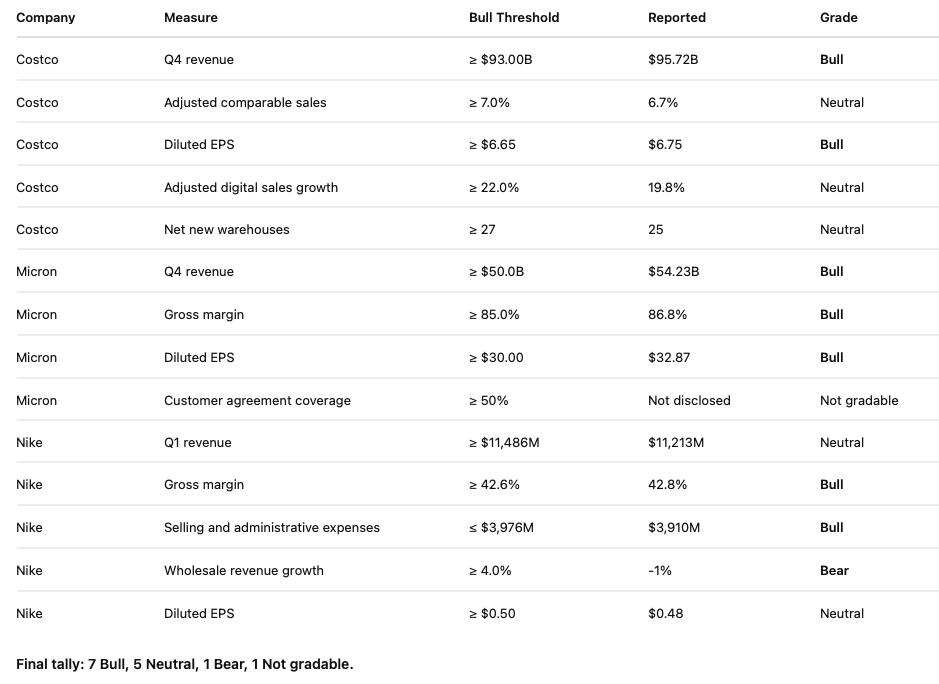
Costco reported quarterly revenue of $95.72 billion, exceeding our $93 billion bullish threshold. Adjusted comparable sales grew 6.7%, digital sales grew 19.8%, and the company added 25 net new warehouses. All three measures finished in the neutral range. Revenue and reported earnings earned bullish grades, giving Costco two Bull and three Neutral results.
The earnings result requires closer examination. Costco reported diluted earnings of $6.75 per share, above our $6.65 bullish threshold. However, a one-time tariff refund contributed $0.15 per share. Without that benefit, earnings would have been approximately $6.60, a neutral result. We retain the official Bull grade because it follows our published rules, but the distinction matters. Costco also reduced its warehouse expansion target twice during the year, from 30 net openings to 28 and then 26, before finishing with 25. Meanwhile, core merchandise margins improved 15 basis points, and capital spending of $6.435 billion remained close to management’s $6.5 billion plan.
The annual filing also introduced new warnings about AI accuracy and AI-driven cybersecurity threats. Looking ahead, management plans approximately $7.5 billion in capital spending and up to 33 warehouse openings, including five relocations, in fiscal 2027. These commitments provide measurable targets for our next assessment.
Micron: Exceptional Results, an Easy Test
Micron exceeded all three financial thresholds we could evaluate. Revenue reached $54.23 billion, gross margin rose to 86.8%, and diluted earnings reached $32.87 per share. The company also exceeded the upper end of its revenue and earnings guidance for the fourth consecutive quarter. Growth extended across all four business units, led by a 420% increase in core data center revenue and 219% growth in cloud memory. The results demonstrate the extraordinary demand for memory products supporting AI infrastructure.
Yet our scorecard exposed a weakness in our own analysis. We set Micron’s bullish revenue threshold at $50 billion, the midpoint of management’s guidance, despite three consecutive quarters above the top of its guidance range. That was not a sufficiently demanding standard. We will correct this in future previews. We also could not grade our customer agreement coverage threshold because Micron did not disclose the required percentage. Its annual filing did disclose $12.75 billion in customer deposits, with nearly all scheduled for repayment between 2029 and 2031. Those agreements provide greater revenue visibility but create future obligations. Management also warned that AI demand might not remain at current levels. Micron finished with three Bull grades and one ungraded measure.
Nike: Better Margins, Weaker Demand
Nike’s results demonstrate why revenue and earnings alone can mislead. Quarterly revenue declined 4% to $11.213 billion, while diluted earnings reached $0.48 per share. Both measures finished in our neutral range. Yet gross margin improved 60 basis points to 42.8%, exceeding our bullish threshold. Selling and administrative expenses declined 3% to $3.91 billion, also earning a Bull grade.
The weakness appeared in wholesale sales, which declined approximately 1%, below our bearish threshold of zero growth. NIKE Brand footwear revenue fell 6% excluding currency effects, while Converse revenue declined 28%. Lower logistics costs and favorable currency effects helped improve margins, but discounts and weaker product demand continued to pressure the business. Nike’s management expects its work at Converse to continue through fiscal 2027 and its Greater China challenges to extend beyond that period. Nike finished with two Bull, two Neutral and one Bear grade. The contrast between improving profitability and declining sales is the central issue we will continue to monitor.
What We Learned
The first scorecard revealed weaknesses in our methods as well as differences in company performance. We will make five changes to improve future assessments:
Account for unusual items. We will state whether earnings thresholds include or exclude one-time benefits and expenses. Costco demonstrated why this matters.
Set more demanding thresholds. We will consider the upper end of management’s guidance when a company has repeatedly exceeded its forecasts, as Micron has.
Use disclosed measures. We will prioritize figures that companies regularly publish. Micron’s customer agreement coverage could not be evaluated.
Look beyond headline results. Nike’s improving margins concealed continued weakness in wholesale demand.
Compare equivalent filings. We will compare annual reports with prior annual reports and quarterly reports with appropriate historical filings to identify genuinely new disclosures.
There is also an important limit to these grades. Strong earnings do not necessarily make a stock a good investment. A company can exceed every bullish threshold and still be expensive relative to its future prospects. Conversely, disappointing results can create an investment opportunity when the share price already reflects excessive pessimism. Our scorecard measures business performance against previously published standards. Valuation and future returns are separate questions.
The Next Scorecards
We have already published previews for AutoZone, BlackBerry, Accenture and Lamb Weston. Each will receive the same treatment: published thresholds, reported results and an accounting of what we got right or wrong.
The first scorecard tells us something about Costco, Micron and Nike. It tells us something more important about our methods. We learned that thresholds must account for management’s guidance, that unusual items can distort reported results, and that headline earnings rarely tell the entire story. These are not reasons to abandon the exercise. They are reasons to repeat it.
The value of a scorecard lies not in the satisfaction of being right, but in the discipline of discovering precisely where one’s judgment was wrong. Financial markets will always reward confidence, at least temporarily. But confidence without accountability is merely an opinion delivered with sufficient conviction. We intend to publish the numbers first, measure the results afterward, and leave the record intact.
About Portfolio Lens
Portfolio Lens compares financial results, management statements and SEC filings to identify changes in company performance. Our What Changed tool examines new filings against earlier reports, while AI analyst personas provide different perspectives on the findings. A person reviews the analysis before publication.
Subscribe to Portfolio Lens Research for earnings previews before companies report and scorecards after the results.
Thresholds first. Grades later. Misses included.
Explore Portfolio Lens at getportfoliolens.com.
For information only. Not investment advice. Nothing in this article is a recommendation to buy, sell or hold any security.